目次へ
package ComplexMap.m を使わなくても 複素関数のグラフィックスを描く方法をドキュメントセンターに見つけた。ComplexMap
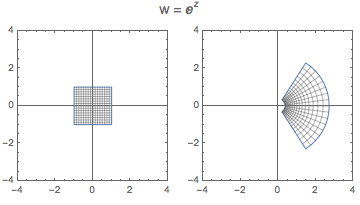
(* CartesianMap of w = exp(z)*)
ParametricPlot[ Through[{Re, Im}[Exp[x + I*y]]], {x, -1, 1}, {y, -1, 1},
 PlotStyle -> None, Mesh -> Automatic]
GraphicsRow[{
 ParametricPlot[ Through[{Re, Im}[x + I*y]], {x, -1, 1}, {y, -1, 1},
   PlotRange -> {{-4, 4}, {-4, 4}}, PlotStyle -> None, Mesh -> Automatic],
 ParametricPlot[ Through[{Re, Im}[Exp[x + I*y]]], {x, -1, 1}, {y, -1, 1},
   PlotStyle -> None, Mesh -> Automatic, PlotRange -> {{-4, 4}, {-4, 4}}]},
 PlotLabel ->
  Style["w = \!\(\*SuperscriptBox[\(\[ExponentialE]\), \(z\)]\)", 14]]
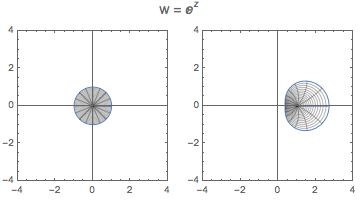
 (* PolarMap  of w = exp(z) *)
ParametricPlot[ Through[{Re, Im}[Exp[r*Exp[I*t]]]], {r, 0, 1}, {t, 0, 2 Pi},
 PlotStyle -> None, Mesh -> Automatic]
GraphicsRow[{
 ParametricPlot[ Through[{Re, Im}[r*Exp[I*t]]], {r, 0, 1}, {t, 0, 2 Pi},
   PlotStyle -> None, Mesh -> Automatic, PlotRange -> {{-4, 4}, {-4, 4}}],
  ParametricPlot[
   Through[{Re, Im}[Exp[r*Exp[I*t]]]], {r, 0, 1}, {t, 0, 2 Pi},
   PlotStyle -> None, Mesh -> Automatic, PlotRange -> {{-4, 4}, {-4, 4}}]},
 PlotLabel ->
  Style["w = \!\(\*SuperscriptBox[\(\[ExponentialE]\), \(z\)]\)", 14]]