目次へ
Mathematica 9 の新機能 > 組み込まれたRとの統合
竹本氏のWeb には Sage で R や python package を自由自在に使った例題がある。これを Mathematica と ipython を使って翻訳を試みることはダビンチコードを解くような魅力を感じる。
- Sage/text/Rとの連携
- R in Action のグラフを Sage で解いてみた
- sage/ggplot_in sage
- sage/Rグラフィックスクックブックを sage で試してみる
第1. については前回の Mathematica 9 の散策(7) で Mathematica の RLink を使って実行できた。
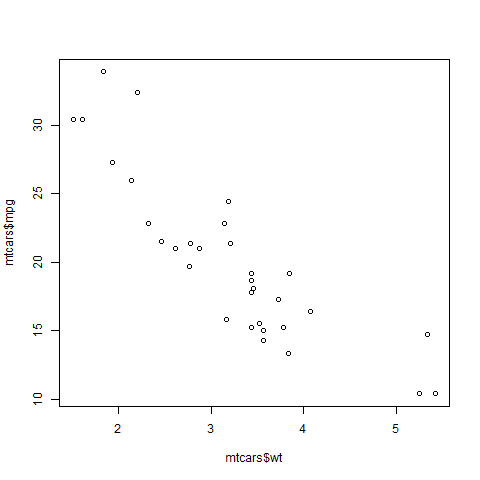
第2. のグラフィックスも同様に可能である。
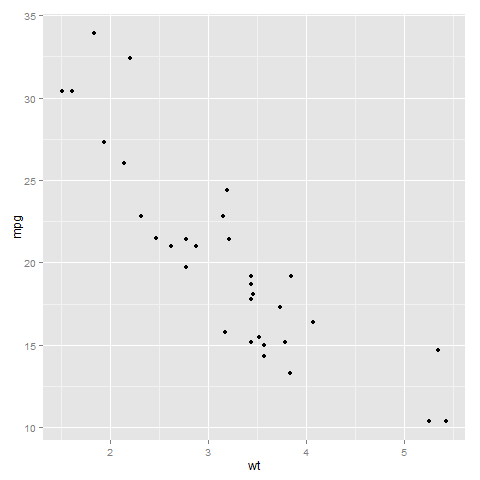
第3. ggplot は python のパッケージなので ipython で実行できた。その後 Mathematica で実行することを考えたが、python で実行するパッケージには制限がある。そこで R の ggplot2 を RLink を使って実行することを思いついた。最終的には第4. がヒントになった。
第4. ggplot でプロットできないものは R の ggplot2 でプロットしている。
RLink は Mathematica 9 で導入された新機能です。 Windows 版では R のパッケージを読むことができるとドキュメントに書いてあるので試すことにした。 ggplot2 を使うことができたのでここに示します。
他方、Mac 版とLinux 版の RLink には R のパッケージを読み込めない制限がある。( Ubuntu版の RLink は残念ながらエラーが発生し動かない。注1)
RLink を使って ggplot2 を実行する( Windows )
Needs["RLink`"]
InstallR["RHomeLocation" -> "C:\\Program Files\\R\\R-2.15.3"];

REvaluate["R.version.string"]
{"R version 2.15.3 (2013-03-01)"}

REvaluate["install.packages(\"ggplot2\")"]   (* 2回めからは必要ない *)
REvaluate["library(ggplot2)"];

REvaluate["p <- qplot(mtcars$wt, mpg$revaluate)"];
Evaluate["plot(p)"];

Evaluate["p <-ggplot(mtcars, aes(x=wt, y=mpg) +  geom_point()"];
Evaluate["plot(p)"];
(* Plotting in output cell (Stack Exchange) *)
mathematicaRPlotWrapper = RFunction["function(filename, plotfun){
           png(filename)
           plotfun()
           dev.off()
           }"];
Clear[getRPlot];
getRPlot[plotFun_RFunction] :=
  With[{tempfile = FileNameJoin[{NotebookDirectory[], "temp.png"}]},
  If[FileExistsQ[tempfile], DeleteFile[tempfile]];
  mathematicaRPlotWrapper[tempfile, plotFun];
  If[! FileExistsQ[tempfile], Return[$Failed]];
  Import[tempfile]]
getRPlot[plotFun_RFunction, outfile_String] :=
  With[{tempfile = FileNameJoin[{NotebookDirectory[], outfile}]},
   If[FileExistsQ[tempfile], DeleteFile[tempfile]];
   mathematicaRPlotWrapper[tempfile, plotFun];
   If[! FileExistsQ[tempfile], Return[$Failed]];
   Import[tempfile]]
Show[#, ImageSize -> Medium, PlotRange -> All] &@
 getRPlot[RFunction["function(){
     plot(mtcars$wt, mtcars$mpg) }
     "], "fig1.png"]
Show[#, ImageSize -> Medium, PlotRange -> All] &@
 getRPlot[RFunction["function(){
          p <- ggplot=( mtcars, aes( x=wt, y=mpg)) geom_point();
          plot(p) }"], "fig3.png="]
まとめ
- R のパッケージ ggplot2 を Winows版 Mathematicaの RLink を使って実行できた。
- 竹本氏のウェブに書いてある Sageのワークシート を参考にした。感謝します。
目次へ
注1) (3月26日2014)
Ubuntu の RLink の問題を Ubuntu フォーラムに問い合わせたところ解決法を教えていただいた。 Mathematica StackExchange の Installing RLink on Linux に解決法が書いてあった。brendan氏の解決法を実行したたところ RLink は無事動いた。皆さんにお世話になり感謝します。
この設定方法は複雑だ。それにくらべ注2)の設定は簡単で汎用性があるように思う。
注2) (7月14日2014)
Wolfram Community で、Ubuntu の RLink の問題の解決法を見つけたのでここにメモをする。Eric Brown 氏の投稿です。
Wolfram Community の "RLink[ ] does not work after R update" のタイトルのところに載っている。 RLink で検索するとみつけることができる。
Needs["RLink`"]
SetEnvironment["LD_LIBRARY_PATH" -> "/usr/lib/R/lib"]
InstallR["RHomeLocation" -> "/usr/lib/R"]

REvaluate["sample(1:100,10)"]
{41, 96, 28, 52, 94, 58, 89, 98, 1, 82}