目次へ
Package 作成の練習として、Roman Maeder, Programming in Mathematica の第1章に載っている複素関数をプロットするパッケージ ComplexMap.m を入力してみた。しかし、これは v.3 で作られたので現在の v.9 で動かない。次の修正を行うことで動くようになったのでメモを書くことにする。
修正点
定義したコマンド CartesianMap [ ] と PolarMap[ ] はグラフィックス関数の Graphics[ ] と ParametricPlot[ ] を呼び出している。これらの関数にオプションを渡す仕組みに関連するものを修正した。
- Needs["Utilities`FilterOptions`"] を削除する。
- opts___?OptionQ を opts:OptionsPattern[] に変更する。
- FilterOptions[Graphics, opts] を Sequence@@FilterRules[{opts},Options[Graphics]] に変更。
- FilterOptions[ParametricPlot, opts] をSequence@@FilterRules[{opts},Options[ParametricPlot]] に変更。
ここで見慣れない Sequence@@ の意味する例で示す。
g[ Sequence@@{a,b,c} ] は g[ a,b,c ] になる。すなわち、リストを表す括弧を取り除くことに対応する。
ComplexMap.m
(* ::Package:: *)
BeginPackage["ProgrammingInMathematica`ComplexMap`"]
CartesianMap::usage= "CartesianMap[f, {x0,x1,dx}, {y0,y1,dy}] plots the image of the Cartesian coordinates lines under the function f.
	The default values of dx and dy are chosen so that the number of lines is equal to the value of the option Lines."
PolarMap::usage="PolarMap[f, {r0, r1,dr}, {p0,p1,dp}] plots the image of the polar coordinate lines under the function f.
	The default for the phi range is {0, 2Pi}. The default values of dr and dphi are chosen so that the number of lines is equal to the value of the option Lines."
Lines::usage = "Lines -> {lx,ly} is an option of CartesianMap and PolarMap
	that gives the number of lines to draw."
$Lines::usage = "$Lines is the default of the option Lines. The value should be a positive integer or a list of two positive integers"
Begin["`Private`"]
$Lines = 15;  (* global default  *)
Options[CartesianMap] = Options[PolarMap] = { Lines :> $Lines }
(*  explicit increments  *)
CartesianMap[ func_, {x0_, x1_, dx_:Automatic}, {y0_, y1_, dy_:Automatic},
	opts:OptionsPattern[] ]:=
	Module[ {x, y},
		Picture[ CartesianMap, func[x + I y],{x, x0, x1, dx},{y, y0, y1, dy}, opts ]
		]/;NumericQ[x0] && NumericQ[x1] && NumericQ[y0] && NumericQ[y1] &&
		(NumericQ[dx] || dx=== Automatic) && (NumericQ[dy] || dy === Automatic
PolarMap[ func_, {r0_, r1_, dr_:Automatic}, {p0_, p1_, dp_:Automatic},
	opts:OptionsPattern[] ] :=
	Module[ {r, p},
		Picture[ PolarMap, func[r Exp[I p]], {r, r0, r1, dr},{p, p0, p1, dp}, opts ]
	]/; NumericQ[r0] && NumericQ[r1] && NumericQ[p0] && NumericQ[p1] &&
		(NumericQ[dr] || dr === Automatic) && (NumericQ[dp] || dp === Automatic)
PolarMap[ func_, rr_List, opts:OptionsPattern[] ] := PolarMap[ func, rr, {0, 2Pi}, opts]
(*  ----  *)
Picture[ cmd_, e_, {s_, s0_, s1_, ds_}, {t_, t0_, t1_, dt_}, opts___ ] :=
	Module[ {hg, vg, lines, nds = ds, ndt = dt},
		lines = Lines /. {opts} /. Options[cmd];
		If[ Head[lines] =!= List, lines = {lines, lines} ];
		If[ ds === Automatic, nds = N[(s1-s0)/(lines[[1]]-1)] ];
		If[ dt === Automatic, ndt = N[(t1-t0)/(lines[[2]]-1)] ];
		hg = Curves[ e, {s, s0, s1, nds}, {t, t0, t1}, opts ];
		vg = Curves[ e, {t, t0, t1, ndt}, {s, s0, s1}, opts ];
		Show[ Graphics[ Join[hg, vg] ],
        Sequence@@FilterRules[{opts},Options@Graphics],
        AspectRatio->Automatic,Axes->True]
	]
Curves[ xy_, spread_, bounds_, opts___ ] :=
	With[{curves = Table[{Re[xy], Im[xy]}, spread]},
		ParametricPlot[curves, bounds,
        Evaluate[Sequence@@FilterRules[{opts},Options@ParametricPlot]]][[1]]
	]
End[ ]
Protect[ CartesianMap, PolarMap, Lines ]
EndPackage[ ]
使用例
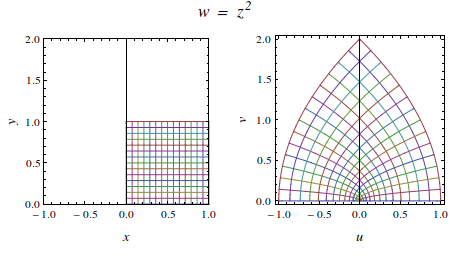
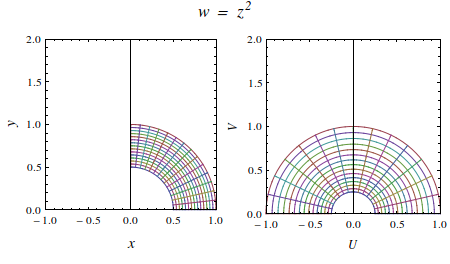
テストのためのノートブック ComplexMap-1.nb と パッケージ ComplexMap.m が同じディレクトリにあるものとする。 この環境で実行したノートブックを次に示す。 複素関数 を Function[z, z^2] で定義し CartesianMap と PolarMap の関数を使ってプロットしている。
SetDirectory[NotebookDirectory[]];
<< ComplexMap.m
GraphicsRow[{CartesianMap[ Identity, {0, 1}, {0, 1},
   PlotRange -> {{-1, 1}, {0, 2}}, Frame -> True,
   FrameLabel -> Evaluate[Style[#, 13, Italic] & /@ {"x", "y"}]],
  CartesianMap[  Function[z, z^2], {0, 1}, {0, 1}, Frame -> True,
   FrameLabel -> Evaluate[Style[#, 13, Italic] & /@ {"u", "v"}]]},
 PlotLabel ->
  Style["w = \!\(\*SuperscriptBox[\(z\), \(2\)]\)", 16, Italic],
 ImageSize -> 450]
CartesianPlot でプロットした図。左は恒等関数のグラフで右が複素関数のグラフです。
次をクリックすると座標を変化させることできます。CartesianMap w = z^2
GraphicsRow[{PolarMap[ Identity, {0.5, 1}, {0, Pi/2} ,
   PlotRange -> {{-1, 1}, {0, 2}}, Frame -> True,
   FrameLabel -> Evaluate[Style[#, 14, Italic] & /@ {"x", "y"}]],
  PolarMap[ Function[z, z^2], {0.5, 1}, {0, Pi/2},
   PlotRange -> {{-1, 1}, {0, 2}},
   Frame -> True,
   FrameLabel -> Evaluate[Style[#, 11, Italic] & /@ {"U", "V"}]]},
 PlotLabel ->
  Style["w = \!\(\*SuperscriptBox[\(z\), \(2\)]\)", 16, Italic],
 Spacings -> 0, ImageSize -> 450]
CartesianPlot でプロットした図。 左は恒等関数のグラフで右が複素関数のグラフです。
次をクリックすると座標を変化させることできます。PolarMap w = z^2
次回に少し詳しい実行例を示します。
