目次へ
IPython 2 では ggplot が動いていたと思う。IPython 3 にアップデートして ggplot のテストしたところ geom_histogram() のところでエラーが発生するようになった。 調べているが対処法が見つからない。備忘録として整理しておこうと思う。
現在、Stackoverflow に質問。その後、開発者より回答があった。
ggplot と pandas のバージョンの違いが原因している。 pandas を 0.15.2 にもどすか、近々リリース予定の ggplot を待つことです。
It's a incompatibility between newer pandas and ggplot. Either fix it yourself (it's just a replacement of "row" to "index": github.com/yhat/ggplot/issues/417#issuecomment-118152169) or downgrade to an older pandas version. OR wait for a newer ggplot version, which could take a while :-( – Jan Schulz Aug 16 at 12:02
A python plotting library emulating R's ggplot2
環境
$ ipython
Python 2.7.10 |Anaconda 2.0.1 (64-bit)| (default, May 28 2015, 17:02:03)
IPython 3.1.0 -- An enhanced Interactive Python.
Anaconda is brought to you by Continuum Analytics.>
ggplot installation
conda install -c https://conda.binstar.org/bokeh ggplotError message


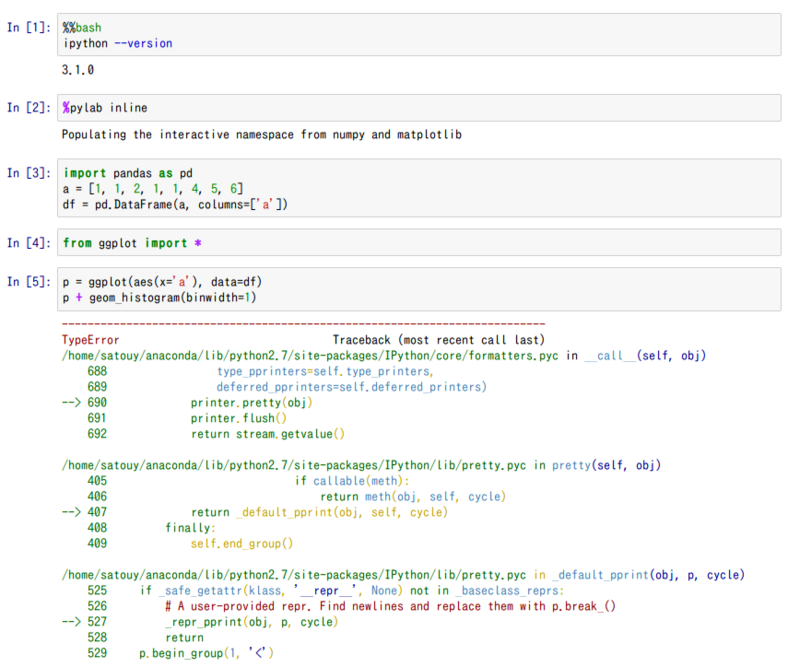
# coding: utf-8
# In[1]:
get_ipython().run_cell_magic(u'bash', u'', u'ipython --version')

# In[2]:
get_ipython().magic(u'pylab inline')

# In[3]:
import pandas as pd
a = [1, 1, 2, 1, 1, 4, 5, 6]
df = pd.DataFrame(a, columns=['a'])

# In[4]:
from ggplot import *

# In[5]:
p = ggplot(aes(x='a'), data=df)
p + geom_histogram(binwidth=1)

# Out[5]
---------------------------------------------------------------------------
TypeError                                 Traceback (most recent call last)
/home/satouy/anaconda/lib/python2.7/site-packages/IPython/core/formatters.pyc in __call__(self, obj)
    688                 type_pprinters=self.type_printers,
    689                 deferred_pprinters=self.deferred_printers)
--> 690             printer.pretty(obj)
    691             printer.flush()
    692             return stream.getvalue()

/home/satouy/anaconda/lib/python2.7/site-packages/IPython/lib/pretty.pyc in pretty(self, obj)
    405                             if callable(meth):
    406                                 return meth(obj, self, cycle)
--> 407             return _default_pprint(obj, self, cycle)
    408         finally:
    409             self.end_group()

/home/satouy/anaconda/lib/python2.7/site-packages/IPython/lib/pretty.pyc in _default_pprint(obj, p, cycle)
    525     if _safe_getattr(klass, '__repr__', None) not in _baseclass_reprs:
    526         # A user-provided repr. Find newlines and replace them with p.break_()
--> 527         _repr_pprint(obj, p, cycle)
    528         return
    529     p.begin_group(1, '<')

/home/satouy/anaconda/lib/python2.7/site-packages/IPython/lib/pretty.pyc in _repr_pprint(obj, p, cycle)
    707     """A pprint that just redirects to the normal repr function."""
    708     # Find newlines and replace them with p.break_()
--> 709     output = repr(obj)
    710     for idx,output_line in enumerate(output.splitlines()):
    711         if idx:

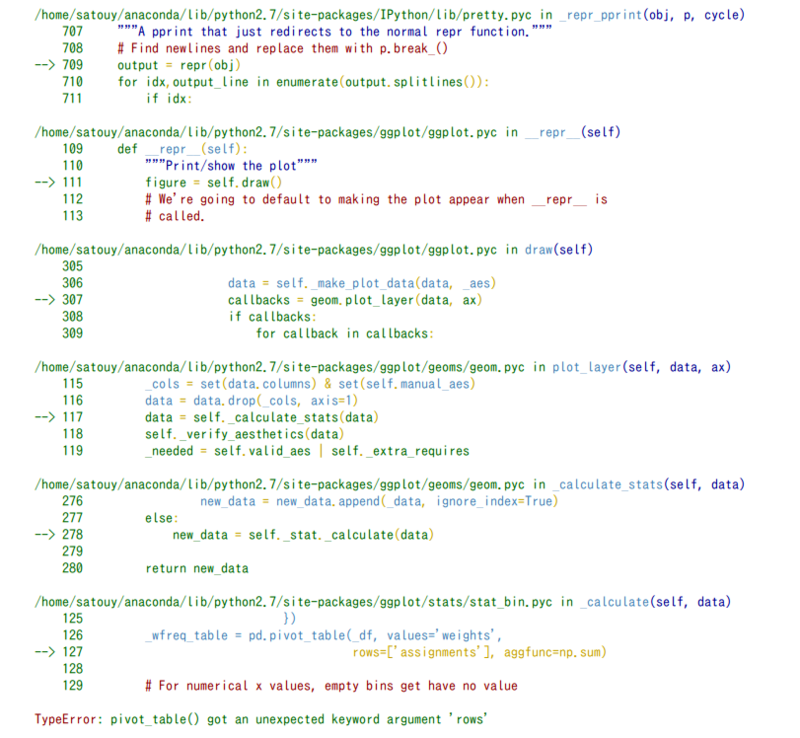
/home/satouy/anaconda/lib/python2.7/site-packages/ggplot/ggplot.pyc in __repr__(self)
    109     def __repr__(self):
    110         """Print/show the plot"""
--> 111         figure = self.draw()
    112         # We're going to default to making the plot appear when __repr__ is
    113         # called.

/home/satouy/anaconda/lib/python2.7/site-packages/ggplot/ggplot.pyc in draw(self)
    305
    306                     data = self._make_plot_data(data, _aes)
--> 307                     callbacks = geom.plot_layer(data, ax)
    308                     if callbacks:
    309                         for callback in callbacks:

/home/satouy/anaconda/lib/python2.7/site-packages/ggplot/geoms/geom.pyc in plot_layer(self, data, ax)
    115         _cols = set(data.columns) & set(self.manual_aes)
    116         data = data.drop(_cols, axis=1)
--> 117         data = self._calculate_stats(data)
    118         self._verify_aesthetics(data)
    119         _needed = self.valid_aes | self._extra_requires

/home/satouy/anaconda/lib/python2.7/site-packages/ggplot/geoms/geom.pyc in _calculate_stats(self, data)
    276                 new_data = new_data.append(_data, ignore_index=True)
    277         else:
--> 278             new_data = self._stat._calculate(data)
    279
    280         return new_data

/home/satouy/anaconda/lib/python2.7/site-packages/ggplot/stats/stat_bin.pyc in _calculate(self, data)
    125                             })
    126         _wfreq_table = pd.pivot_table(_df, values='weights',
--> 127                                       rows=['assignments'], aggfunc=np.sum)
    128
    129         # For numerical x values, empty bins get have no value

TypeError: pivot_table() got an unexpected keyword argument 'rows'
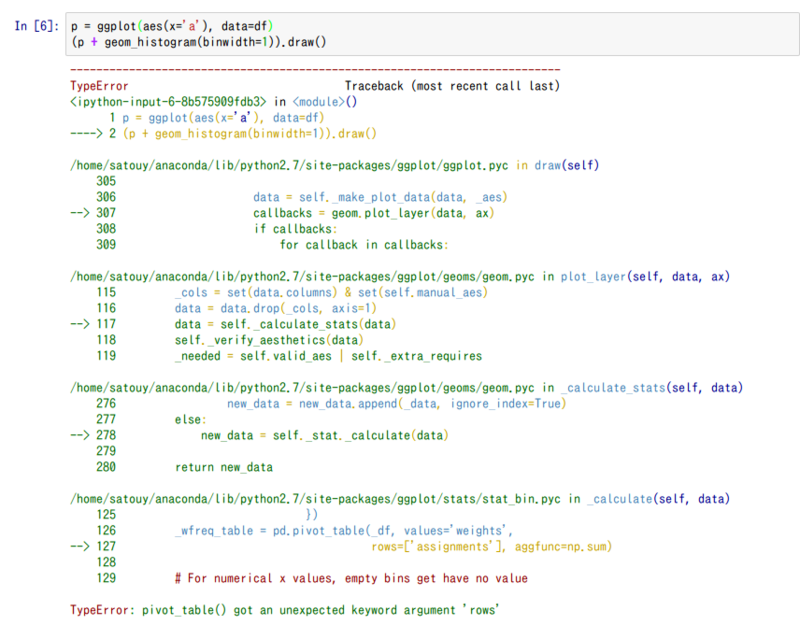
# In[6]:
p = ggplot(aes(x='a'), data=df)
(p + geom_histogram(binwidth=1)).draw()

# Out[6]
---------------------------------------------------------------------------
TypeError                                 Traceback (most recent call last)
 in ()
      1 p = ggplot(aes(x='a'), data=df)
----> 2 (p + geom_histogram(binwidth=1)).draw()

/home/satouy/anaconda/lib/python2.7/site-packages/ggplot/ggplot.pyc in draw(self)
    305
    306                     data = self._make_plot_data(data, _aes)
--> 307                     callbacks = geom.plot_layer(data, ax)
    308                     if callbacks:
    309                         for callback in callbacks:

/home/satouy/anaconda/lib/python2.7/site-packages/ggplot/geoms/geom.pyc in plot_layer(self, data, ax)
    115         _cols = set(data.columns) & set(self.manual_aes)
    116         data = data.drop(_cols, axis=1)
--> 117         data = self._calculate_stats(data)
    118         self._verify_aesthetics(data)
    119         _needed = self.valid_aes | self._extra_requires

/home/satouy/anaconda/lib/python2.7/site-packages/ggplot/geoms/geom.pyc in _calculate_stats(self, data)
    276                 new_data = new_data.append(_data, ignore_index=True)
    277         else:
--> 278             new_data = self._stat._calculate(data)
    279
    280         return new_data

/home/satouy/anaconda/lib/python2.7/site-packages/ggplot/stats/stat_bin.pyc in _calculate(self, data)
    125                             })
    126         _wfreq_table = pd.pivot_table(_df, values='weights',
--> 127                                       rows=['assignments'], aggfunc=np.sum)
    128
    129         # For numerical x values, empty bins get have no value

TypeError: pivot_table() got an unexpected keyword argument 'rows'

# In[ ]:
その後
- IPython は進化して Jupyter になった。 ggplot は IPython 3 に対応してないように思う。 (間違い)
- ggplot と pandas のバージョンの違いが原因している。 pandas を 0.15.2 にもどすか、近々リリース予定の ggplot を待つことです。
- ggplot を学ぶことが目的ならば次の方法がある。
- RStudio + ggplot2
- IPython + rpy2 + ggplot2
- Mathematica + RLink + ggplot2