目次へ
Getting Started with Mathematica, Third Edition
p.161
Scatter Diagrams
Life expectancy 平均寿命,
データ構造 {"country", "male life expectancy", "female expectancy"}
data = {{"Argentina", 70.0, 77.5}, {"Austria", 75.5,  81.5},
{"Afganistan", 43.0, 43.0}, {"Algeria", 72.5, 74.2}, {"Bolivia", 59.8, 63.2},
{"Brazil", 68.1, 75.8}, {"Belgium", 76.5, 82.4}, {"Bangradesh", 64.7, 65.9},
{"Botswana", 65.7, 69.0}};
BarCharts
The home run totals for North American baseball teams of the National League for the 2008 season, accompanied by abbreviated city names.
natLeagueHomeRuns = {{159, "Ar"}, {130,"At"}, {184, "Ch"}, {187, "Ci"},
   {160, "Co"}, {208, "Fl"}, {167, "Ho"}, {137, "LA"},
   {198, "Mi"}, {172, "NY"}, {214, "Ph"}, {153, "Pit"},
   {154, "SD"}, {94, "SF"}, {174, "SL"}, {117, "WA"}};
Pie Charts
Federal spending in 2002 according to the United States Department of the Treasury.
spending = {{0.03, "low enforcement"},
   {0.38, "social security"}, {0.08, "interest"},
   {0.10, "development"}, {0.20, "defense"},
   {0.21, "social programs"}};
Numerical Measures
The home run totals for North American baseball teams of the National League for the 2008 season
homeRuns = {159, 130, 184, 187, 160, 208, 167, 137, 198, 172, 214,
   153, 154, 94, 174, 117};
Mathematica Stack Exchange
参考になる記事を見つけた。
How to create a histogram from a given frequency table
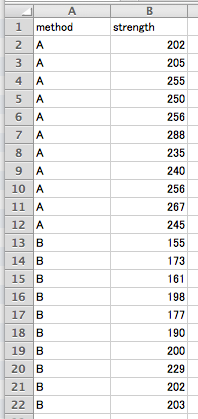
次のデータは「R とRコマンダーえはじめる実験計画法」荒木 孝治 著 p.19 に載ってるものです。
データ strength.xlsx
