目次へ
Mathematica 9 の新機能 > 組み込まれたRとの統合
竹本氏のウェブページには Sage の例題が沢山載っいる。その中で「 Rとの連携 」に興味を持った。Sage からR言語コードを実行するノートブックである。公開のSageサーバーを利用して実行することができるので利用させていただいている。
一方、Mathematica では RLink を使って R言語コード を実行することができる。Sage のノートブックを見るにつけ Mathematica に翻訳できないものか考えていた。今回、翻訳に成功したのでここに書くことにした。参考にしたものを次にあげる。
- Mathematica ドキュメントセンター RLink
- How to get a plot generated by R returned in an output cell? ノートブックの出力セルにプロットを表示させるために参考にした。
- Getting R textual output into Mathematica R の summary をテキストで表示させるために参考にした。
R との連携 (Hiroshi TAKEMOTO (take@pwv.co.jp) 氏の項目を参考にした)
RLink を起動する
Needs["RLink`"];
InstallR[ ];
(* Rコードを実行 *)
REvaluate["sqrt(2)"]
 ⇒ {1.41421}
Rコマンドファイルの実行
wd = NotebookDirectory[ ];
SetDirectory[wd];
FileNames[ ]
 ⇒ {"mystat.txt", "sage-text-R-1.nb"}
FilePrint["mystat.R"]
x2<- function(x) { return (x^x) }filename = FileNameJoin[{wd, "mystat.R"}];
RSet["filename", filename];
REvaluate["source(filename)"];
REvaluate["{
l <-c(1,2,3);
lapply(l,x2)
}"]
⇒ {{1.}, {4.}, {27.}}
Mathematica から変数(リスト)を R に渡す
s1 = {1, 2, 3};
rl = RSet["l", s1];
REvaluate["l"]
Head[rl]
rl
⇒{1, 2, 3}
 List
 {1, 2, 3}
Mathematica からマトリックスを R に渡す
list = {1, 2, 3, 4};
RSet["vec", list];
m = REvaluate["m <- matrix( vec, 2, 2, byrow=TRUE)"]
m == REvaluate["m"]
 ⇒ True
文字列リストの変換
ary = {"a", "b"};
RSet["ary", ary];
REvaluate["ary"] == ary
 ⇒ True
getRPlot 関数
参考2に載っている関数を利用した。
mathematicaRPlotWrapper = RFunction["function(filename, plotfun){
        png(filename)
        plotfun()
        dev.off()
        }"];
Clear[getRPlot];
getRPlot[plotFun_RFunction] :=
  With[{tempfile = FileNameJoin[{NotebookDirectory[], "temp.png"}]},
   If[FileExistsQ[tempfile], DeleteFile[tempfile]];
   mathematicaRPlotWrapper[tempfile, plotFun];
   If[! FileExistsQ[tempfile], Return[$Failed]];
   Import[tempfile]];
getRPlot[plotFun_RFunction, outfile_String] :=
  With[{tempfile = FileNameJoin[{NotebookDirectory[], outfile}]},
   If[FileExistsQ[tempfile], DeleteFile[tempfile]];
   mathematicaRPlotWrapper[tempfile, plotFun];
   If[! FileExistsQ[tempfile], Return[$Failed]];
   Import[tempfile]];
R のプロット関数
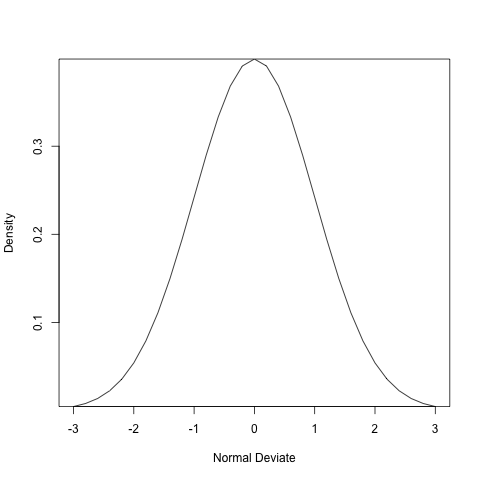
(* X11 にプロットが表示される *)
Evaluate["dev.new()"];
REvaluate["{
     x <- pretty( c(-3, 3), 30);
     y <- dnorm(x);
     plot(x, y, xlab="\"Normal" deviate="" ylab="\"Density\",yaxs=\"i\")
}"]
REvaluate["dev.off( )"];
(* ノートブックにプロットを表示する  *)
Show[#, imagesize=""> Medium, PlotRange -> All] &@
getRPlot[RFunction["function(){
   plot(x, y, type='l',xlab=\"Normal Deviate\",ylab=\"Density\",yaxs=\\"i\")}"],
   "fig1.png"]

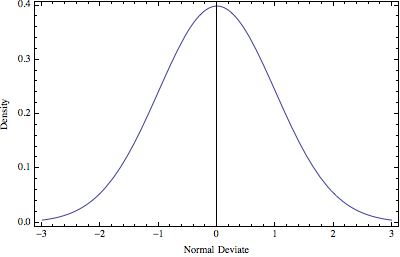
R の関数を使って Mathematica でプロット
f = RFunction["function(x){dnorm(x)}"];
Plot[f[x], {x, -3, 3}, Frame->True,FrameLabel -> {"Normal Deviate", "Density"}, ImageSize -> 400]

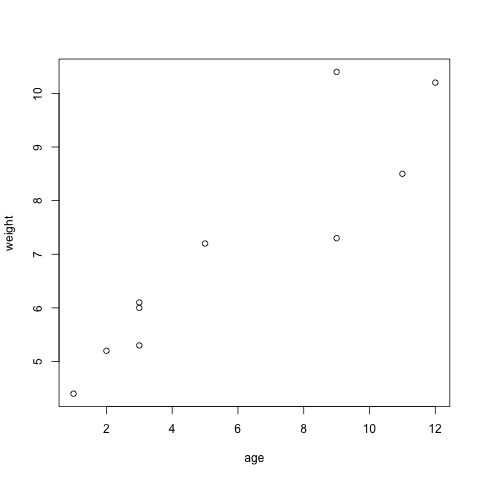
R の plot 関数を使ったプロット
age = {1, 3, 5, 2, 11, 9, 3, 9, 12, 3}; RSet["age", age];
weight = {4.4, 5.3, 7.2, 5.2, 8.5, 7.3, 6.0, 10.4, 10.2, 6.1}; RSet["weight", weight];

Show[#, ImageSize -> Medium, PlotRange -> All] &@
 getRPlot[RFunction["function(){plot(age, weight)}"], "fig2.png"]

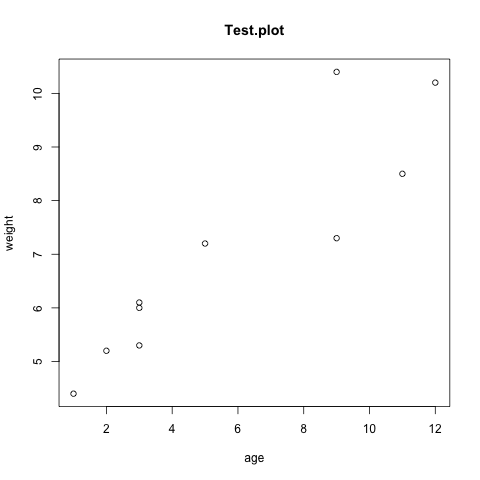
plot のプションを指定
Show[#, ImageSize -> Medium, PlotRange -> All] &@
 getRPlot[RFunction["function(){
   plot(age, weight, main='Test.plot')}"], "fig3.png"]

データファイルからの集計
dir = SetDirectory[NotebookDirectory[ ]];
FilePrint["Data.txt"]
⇒ diabetes     status
  Type1	Poor
  Type2	Improved
  Type1	Exellent
  Type1	Poor
データファイルの読み込み
filename = FileNameJoin[{dir, "Data.txt"}];
RSet["filename", filename];
df = REvaluate["d <- read.table( filename, header=T)"]
⇒ RDataFrame[RNames[diabetes,status],RData[RFactor[{1,2,1,1},RFactorLevels[Type1,Type2]],RFactor[{3,2,1,3},RFactorLevels[Exellent,Improved,Poor]]],RRowNames[1,2,3,4]]
TableForm[df]クロス集計(参考3の表示を使用した)
StringJoin@Riffle[#, "\n"] &@
 REvaluate[
  "table.text <- capture.output(print(table(d$diabetes, d$status)) )"]
     Exellent  Improved  Poor
Type1       1         0     2
Type2       0         1     0
まとめ
- Mathematica の RLink を使ってR言語コード を実行することができた。
- 竹本氏のウェブページにに載っている Sageのノートブック「Rとの連携」を参考にさせていただきました。感謝いたします。
